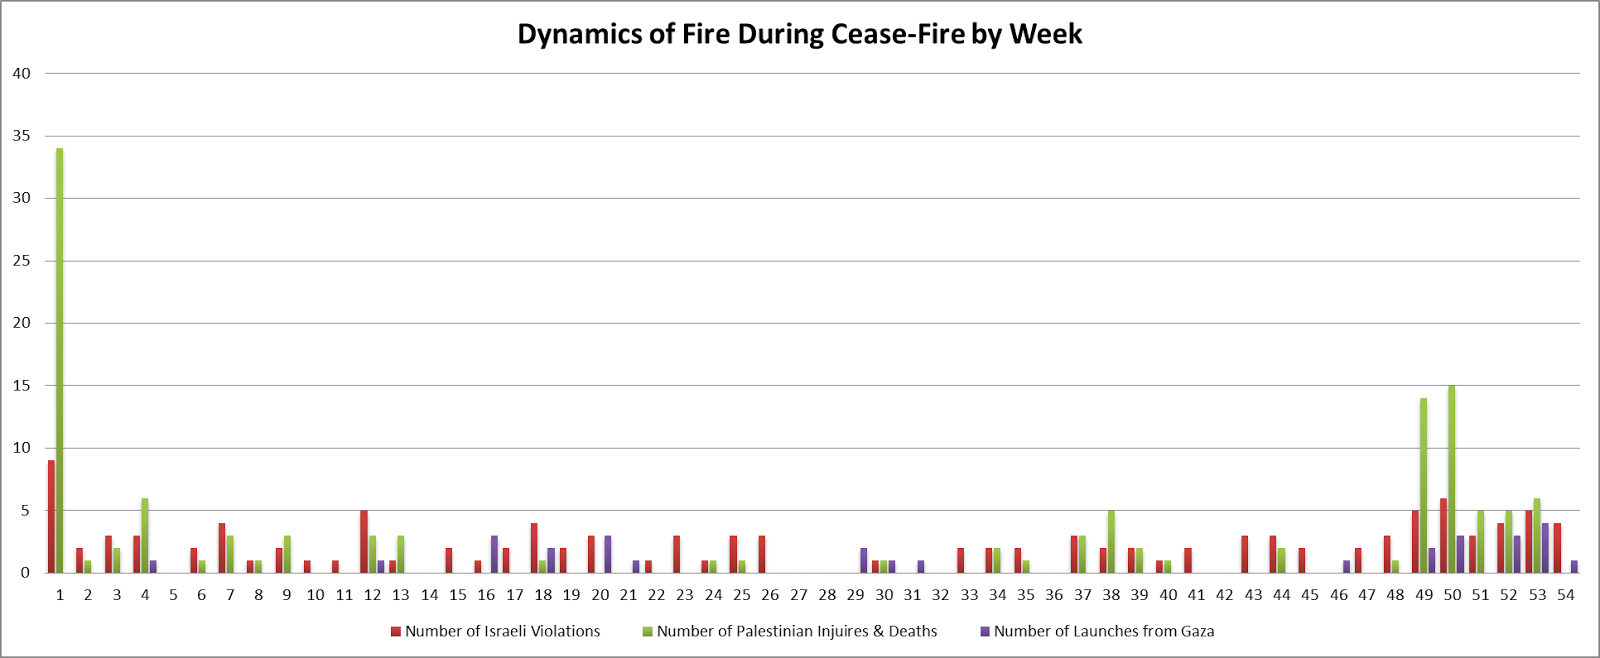
The chart below depicts a few things; Israeli cease-fire violations, Palestinian projectile launches and Palestinian casualties that resulted from Israeli cease-fire violations week by week of the cease-fire through January 2014. A few notes on the data; first, we refer to “projectiles” because there are different types of projectiles that are deployed, not all are “rockets” and thus “rockets” alone, the preferred parlance of the Israeli state, isn’t an accurate descriptor. Additionally, we are not focusing on each individual piece of ordinance but rather on events. So if one projectile is launched or two are launched together, these are the same event. Likewise, we don’t count each individual piece of ordinance Israel deploys in an airstrike wherein it routinely drops several bombs in a singular event. If we did, the number of Israeli violations would surely be much, much higher. For example, the Israeli human rights group B’tselem, citing the Israeli Shin Bet, notes that nearly 14,000 projectiles were fired from Gaza from 2005 to 2013. UN OCHA noted that Israel fired about the same number of artillery shells into Gaza……in 2006 alone. Lastly, the Shin Bet keeps numbers on Palestinian fire from Gaza but does not differentiate between fire at Israeli targets that have entered Gaza vs. those outside it. Also, it does not have data available at the week level, only the month level. Even using their numbers for Palestinian fire though, Israeli violations outnumber them nearly two to one.
There really is no comparison between Israel’s capacity to destroy and the combined capacity of all the factions in Gaza. The point here is to understand how the events relate to each other, what leads to escalation, and how this effects the durability of the cease-fire agreement.
As you can see from the chart, Israeli cease-fire violations have been persistent throughout and have routinely resulted in Palestinian injuries and deaths. Palestinian launches have been rare and sporadic and occurred almost always after successive instances of Israeli cease-fire violations. You can see a steady escalation from around week 48 and onward. This corresponds with mid-December during which Israel committed several cease-fire violations resulting in multiple Palestinian casualties. There was no Palestinian projectile fire in the two weeks prior to these Israeli violations which inflicted high causalities. This means that this week was the escalation point and it was Israel doing the escalating. You can see that the following weeks continue to feature exchanges that included high Palestinian casualties. You may wonder why you don’t see Israeli casualties from Palestinian projectile fire depicted on this chart, that is because as afar as I can tell, there weren’t any during this period.
via Permission to Narrate: Israel/Gaza Cease-Fire Dynamics Breakdown.
